Acte I · The problem
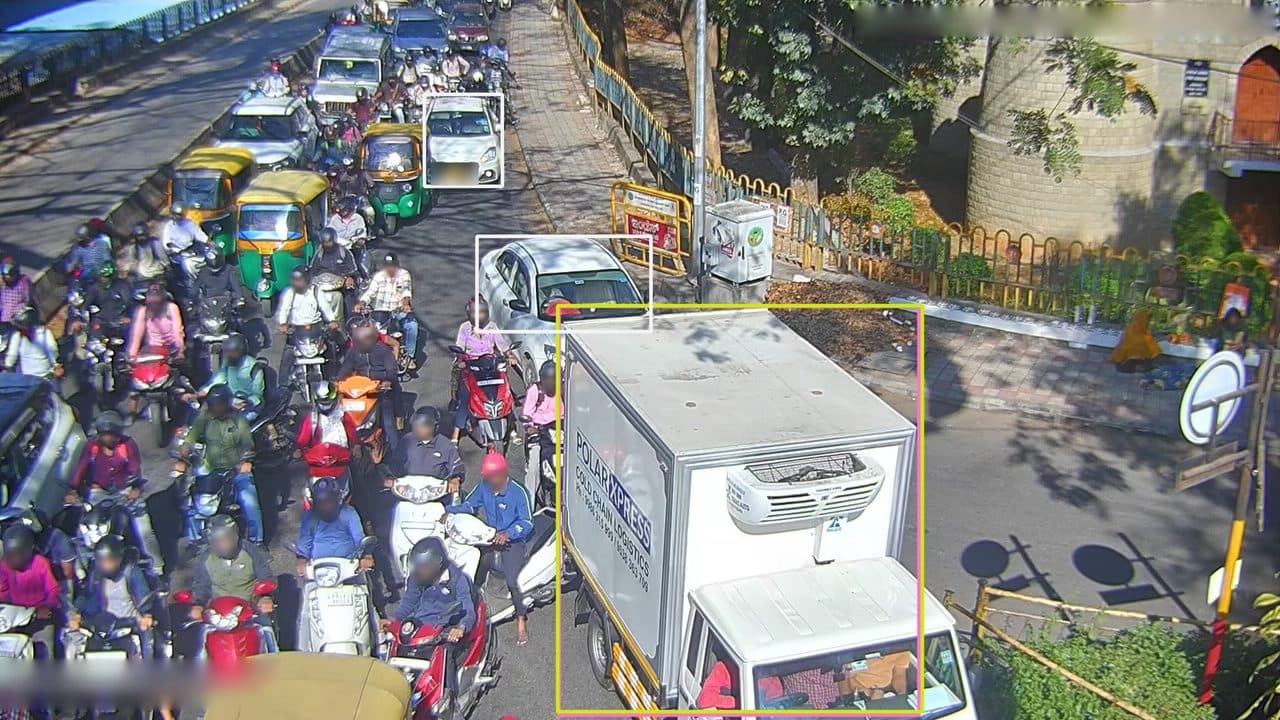
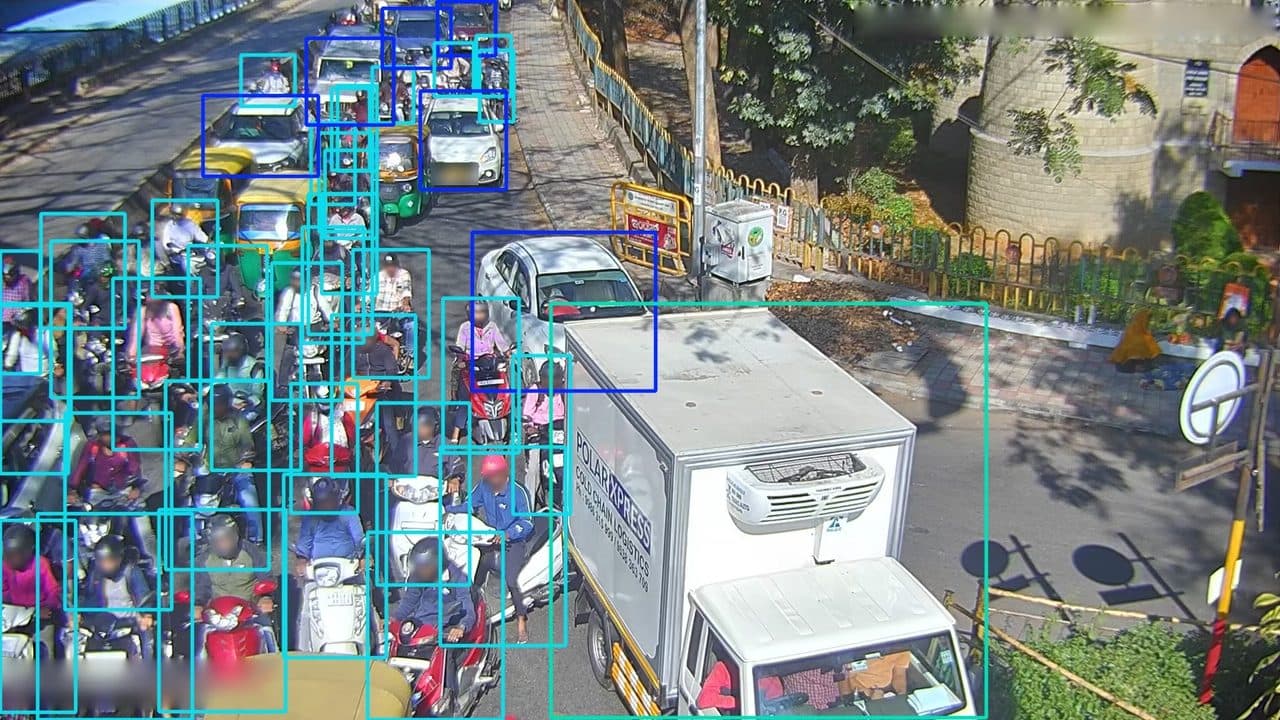
YOLOv8 pre-trained on COCO recognises a car that fills the frame very well. But in a traffic-jam scene filmed from above, distant vehicles become tiny and overlap, and that is exactly where the general-purpose model falls apart.
The project’s question is precise: what does fine-tuning on dense-traffic data really change, properly measured, especially on small objects?
Acte II · The approach
First observation, owned from the start: there is no public computer-vision dataset specific to Benin. Rather than pretend otherwise, the project uses the public dataset closest to the problem: BMD-45, filmed by surveillance cameras in Bengaluru, India. The Beninese context is the motivation of the project, not the provenance of its data, and that transparency is part of the protocol.
- About 3,000 images extracted from BMD-45 (45,000 in total), with an isolated train / test split.
- 4 COCO-compatible classes: car, motorbike, bus, truck.
- YOLOv8n evaluated as is, then fine-tuned on this data.
- Comparison on the same test set, recall broken down by object size: small, medium, large.
rule of the game: everything is fixed before the first training run; what you fix beforehand protects you from what you’d like to tell yourself afterwards
Acte III · The results
| Metric | Before | After | Change |
|---|---|---|---|
| mAP@0.5 | 0.438 | 0.825 | +88.4% |
| mAP@0.5:0.95 | 0.296 | 0.644 | +117.8% |
| Precision | 0.496 | 0.833 | +67.9% |
| Recall | 0.417 | 0.714 | +71.1% |
| F1 score | 0.453 | 0.769 | +69.6% |
| Throughput (FPS) | 37.2 | 43.2 | +16.2% |
- Small (804)0.12 → 0.69 · +469.3 %
- Medium (1,415)0.37 → 0.88 · +135.6 %
- Large (332)0.79 → 0.95 · +20.1 %
These figures hold on the BMD-45 test set, not on Beninese roads, for lack of public local data. And inference on an ordinary CPU takes 1 to 2 seconds per image: enough for a demonstration, not for real time without dedicated hardware.
Acte IV · What I learned
Averages lie by omission
The starting model’s global mAP didn’t say the essential: almost nine small vehicles out of ten missed. The breakdown by size is what put the real problem on the table. Since then, I don’t trust a metric before I’ve sliced it.
The protocol is played beforehand
Like a chess opening: an isolated test set, metrics and comparison rules decided before the first training run. What you fix beforehand protects you from what you’d like to tell yourself afterwards.
Transparency is a methodological choice
Writing in black and white that no Beninese dataset exists made the project stronger, not weaker: we know exactly what our figures prove, and what they don’t.
A recall of 0.12 is nothing to be ashamed of
It’s the beginning of the story. The characters of my favourite stories grow by falling; a model progresses the same way, and so does the person training it.
documenting is thinking: every page written clarified a decision while there was still time to change it